The atmosphere acts like a prism, refracting star light so that the apparent elevation of the star changes. This effect is dependent on the actual elevation, the temperature, pressure, and the wavelength of the light. The differential refraction by wavelength is called dispersion.
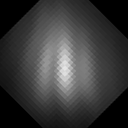
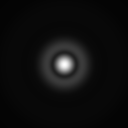
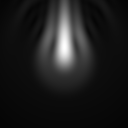
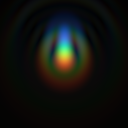
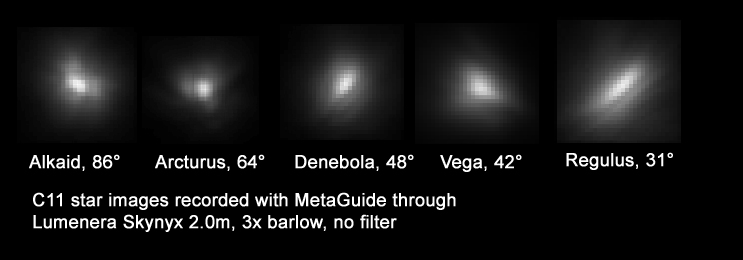
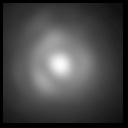
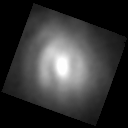
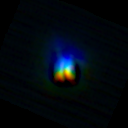
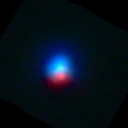
Dispersion impacts ground-based observing by smearing a star's light over a vertical line. The long wavelengths have a larger overall point spread function (PSF) while the shorter wavelengths are increasingly smaller. This shrinking of the PSF along the length of dispersion results in a wedge/teardrop shape. Actual and simulated images are shown below.
|
|
|
This article presents direct measurement of star elongation and provides simulations of the effect.
| Instruments | Aperture | Total Focal Length |
| PlaneWave Instruments CDK12.5 with Televue 5x PowerMate | 317.5mm | 12700mm |
| Celestron C11 XLT with Televue 5x PowerMate | 280mm | 14000mm |
| Celestron C11 XLT with Televue 3x Barlow | 280mm | 8400mm |
| Celestron Onyx80EDF with Televue 5x PowerMate and Televue 3x Barlow | 80mm | 7500mm |
| Celestron Onyx80EDF with Televue 5x PowerMate and Televue 2.5x PowerMate | 80mm | 6250mm |
| Camera | Pixel Size | Sensor |
| Lumenera Skynyx 2.0m | 7.4um | Sony ICX424AL |
| Celestron NexImage | 5.6um | Sony ICX098BQ |
| Filter | Band pass |
| Baader UV/IR cut | 420-680nm |
| Custom Scientific Red | 612-662nm |
| Custom Scientific Green | 488-575nm |
| Custom Scientific Blue | 388-513nm |
| Baader UHC-S | 450-525nm, 625-675nm |
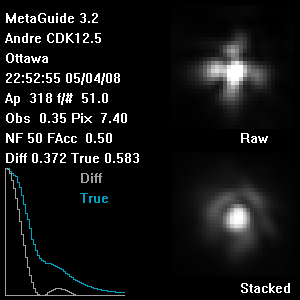
MetaGuide is a free PC application that (among other things) helps to view an in-focus star image so that you can see the Airy pattern and tweak the collimation as required. MetaGuide discards bad frames and stacks good frames and shows you a 4x zoom of the star. It also plots the star profile against the expected profile for your optics. MetaGuide requires use of a camera capable of 640x480 video with direct show access -- it works with both the Lumenera and NexImage cameras.
LUCAM Recorder is image acquisition software for the Lumenera camera.
K3CCDTools is a general purpose acquisition software package, used with the NexImage camera in this document.
Registax allows alignment, stacking, and sharpening of a series images.
MaximDL is a general purpose astronomy image processing package.
Refraction is a function of both wavelength and elevation. Dispersion is the "rainbow effect" that occurs when light refracts at different angles according to wavelength. The Near-infrared Integral-Field Spectrograph group has a discussion of the dispersion that occurs on their near-infrared sensors, and provides an outline of the formulae for calculating the dispersion.
Refract.exe is a simple visual basic application that uses the formuale above to calculate the expected dispersion given elevation, temperature, pressure, and a range of wavelengths. This can be useful for quantifying the extent of the dispersion when imaging or collimating.
The appearance of the Airy pattern in the presense of dispersion can be described as an integration of individual Airy patterns for each wavelength in the band of interest. A simulation program was developed to output the star profiles for a given wavelength and then to include the smearing effect of dispersion (and change in size of Airy pattern) as the wavelength changes. Other wavelength dependent variables are also considered, including optical coatings, camera response, and extinction.
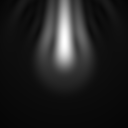
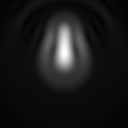
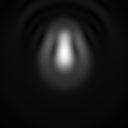
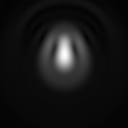
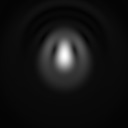
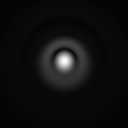
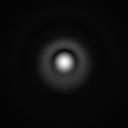
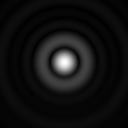
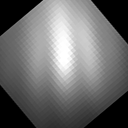
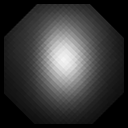
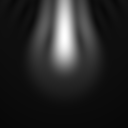
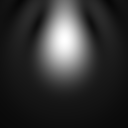
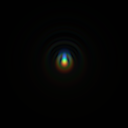
The images below show the expected change in shape of the Airy pattern on the CDK 12.5" telescope with a UV/IR cut filter and Lumenera camera from 30 to 90 degrees elevation. Note that these and all simulations in this article assume a temperature of 15 degrees Celsius and a pressure of 99.2 kPa.
 |
 |
 |
 |
 |
 |
 |
 |
 |
 |
 |
 |
 |
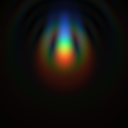
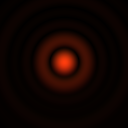
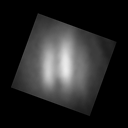
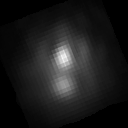
The following images show the expected changes with filter of the Airy pattern on the CDK 12.5" telescope at 35 degrees elevation. Both Lumenera and NexImage (color) outputs are shown. Note the interesting appearance of the UHC-S filter results. The two distinct pass regions are expected to produce a separation in the recorded dispersion.
 |
|
 |
 |
 |
 |
 |
 |
 |
 |
 |
 |
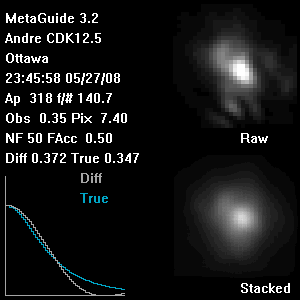
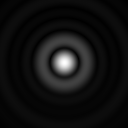
Under conditions of reasonable seeing, long focal lengths can be used to image the Airy pattern. The MetaGuide software helps to do this in realtime by stacking good frames and rejecting bad frames. Many of the images below were taken using MetaGuide, where the stacked star image was cropped from the software output image to save space. An example of the complete MetaGuide output is shown below:
In some cases, image acquisition was also done using LUCAM Recorder or K3CCDTools. Recorded video from these applications is post-processed in Registax.
Note that simulation output was adjusted with a gamma of 0.5 so that it is easier to see and so that it better matches the recorded star profiles. The energy in the recorded Airy patterns tend to be spread out around the PSF, resulting in a stronger first diffraction ring and lower contrast between the central peak and the rings.
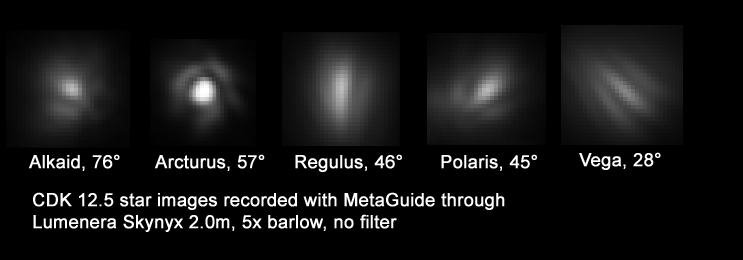
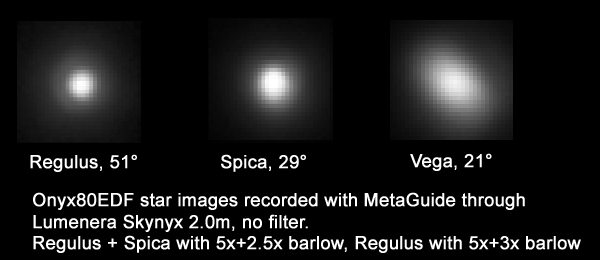
The following images illustrate the change in recorded elongation with elevation on various optical configurations.
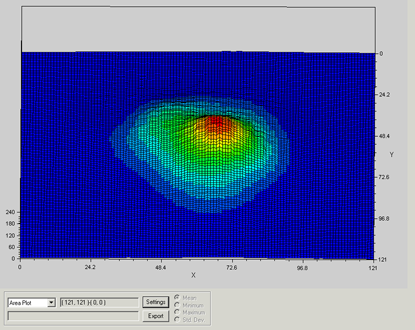
To see the change in the extent and the angle of elongation over time, MetaGuide was used to record images of Arcturus from a position just past the meridian until a point about 30 degrees above the west horizon. An image was taken every minute and a video made from the data. The images were also post-processed with Maxim/DL to show an area plot of the star profile in a separate video. Individual frames of each video are shown below -- clicking on the images will download zipped versions of the full video.
In the videos, the angle of elongation can be seen to start at approximately the 11 o'clock position and proceed in a clockwise direction as the mount proceeds west. Since a German Equatorial mount was used, we expect the angle with respect to the horizon to change from near-vertical to approximately 45 degrees past vertical over this time.
Below is a comparison of actual observations of Vega in different configurations to simulation results. Recorded images were rotated to match the orientation of the simuation.
|
|
 |
 |
|
|
 |
 |
The following images were taken on the CDK12.5 telescope with 5x barlow and various filters. Simulation output is shown below the recorded images. Recorded images were rotated to match the simulation.
Note that the expected simulation results are a fairly good match to the recorded stars, and that the chromatic aspect of the dispersion can be clearly seen in the color images.
 LUCAM Recorder + Registax |
 LUCAM Recorder + Registax |
 LUCAM Recorder + Registax |
 Lumenera + MetaGuide |
 K3CCD + NexImage + Registax |
 K3CCD + NexImage + Registax |
 |
 |
 |
 |
 |
 |
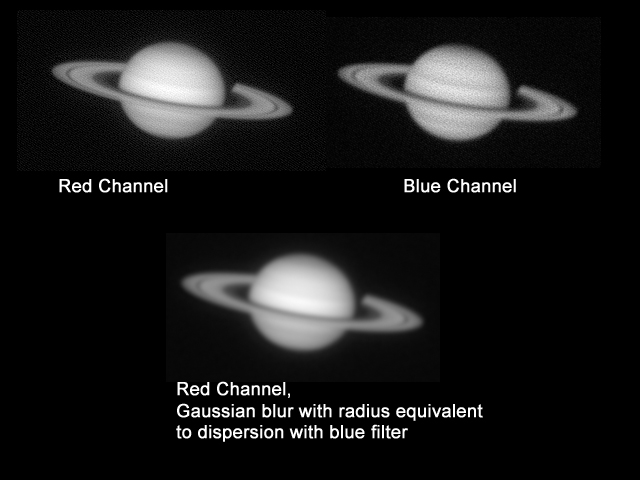
Dispersion is clearly an effect that has an impact on amateur astronomers. The measured and simulated results show that the extent of dispersion is quite significant, especially at shorter wavelengths. There are two situations where this can become especially important: planetary imaging and collimation.
Images taken through short wavelength filters with even a small band pass at low elevations can result in a large dispersion. The image below shows recorded red and blue channels from Saturn at about 45 degrees elevation. The red channel is obviously sharper than the blue channel. To illustrate that this difference is largely due to dispersion, a gaussian blur is performed on the red channel with a radius equivalent to the dispersion expected with the blue filter. The resulting level of detail in the blurred red image is similar to that of the original blue image.
Similarly, images taken through a long wavelength or narrowband filter can signicantly reduce the extent of the recorded dispersion. Lunar images taken through a red or IR-only filter will be far less impacted by dispersion than through a UV-IR cut filter or with no filter.
As can be seen in the recorded and simulated images above, the Airy pattern quickly becomes noticeably elongated at elevations away from the zenith. When performing an in-focus collimation, it is important for overall shape to be round in order to center the peak and diffraction rings properly -- even small amounts of dispersion can affect this. Again, it is recommended to collimate on a star near the zenith and/or use a long wavelength or narrowband filter to reduce these effects.
Many thanks to those who have helped already, including Frank FreeStar8n and Dave Rowe.